Greeks – Option Price Sensitivities – A cheat sheet to Delta, Gamma, Vega, Theta & Rho.
While we have done a few posts earlier about option price sensitivities, here is a quick reference guide for the truly lost and confused. For convenience the reference guide has been broken down into the following sections
- Greeks Formula Reference
- Greeks – Suspects Gallery – a visual review of option Greeks across 4 dimensions and money-ness
How to analyze Greeks in time for your final exam/interview/assessment/presentation tomorrow morning
While there are many ways of dissecting Greeks a framework or frame of reference helps. Here are some basic ground rules.
1. Remember the first order Greeks and separate them from second order sensitivities. Delta, Theta & Rho are first order (linear) Greeks which means that they will be different for Call Options and Put Options. Gamma and Vega are second order (non linear) Greeks which means that they will be exactly the same for Calls and Puts.
2. Remember that in most cases Greeks will behave differently depending on the “in-the-money-ness” of the option. Greeks will behave and look differently between Deep Out, At, Near and Deep In the money options.
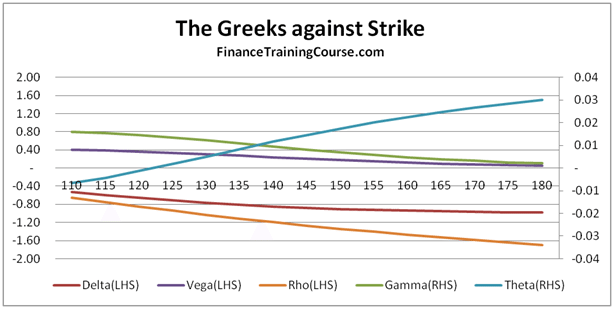
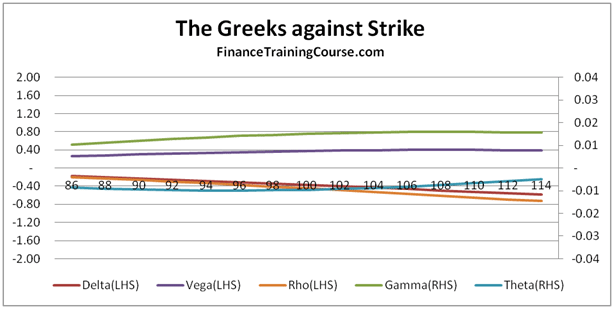
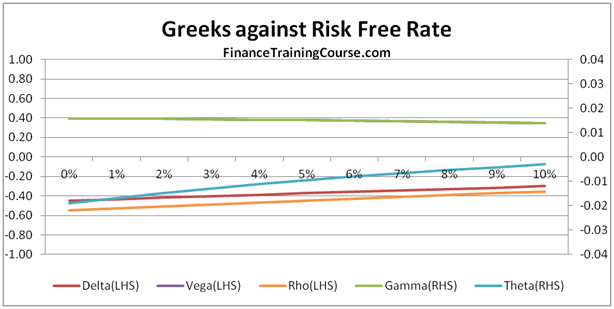
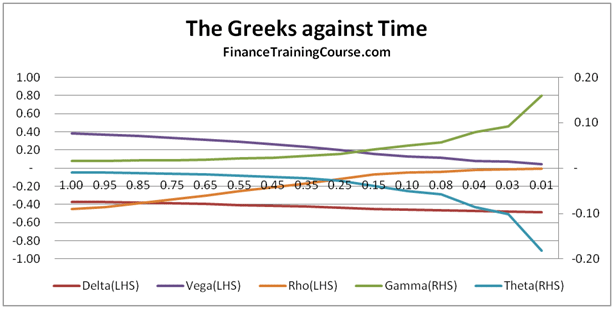
3. Think how the Greeks will change or move as you change the following parameters:
- Spot
- Strike Price
- Time to Maturity or expiry
- Volatility of the underlying
- Interest Rates
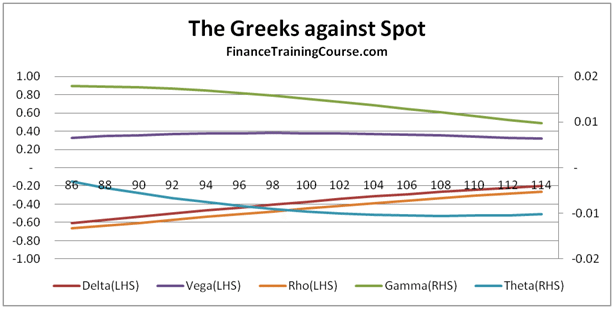
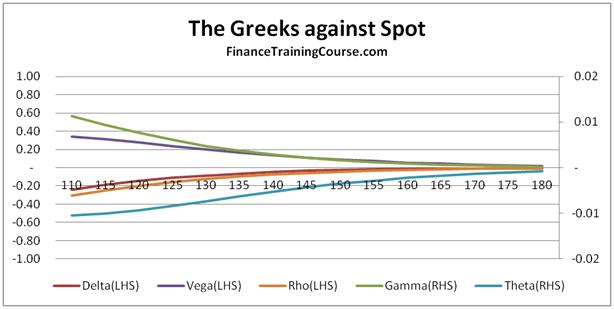
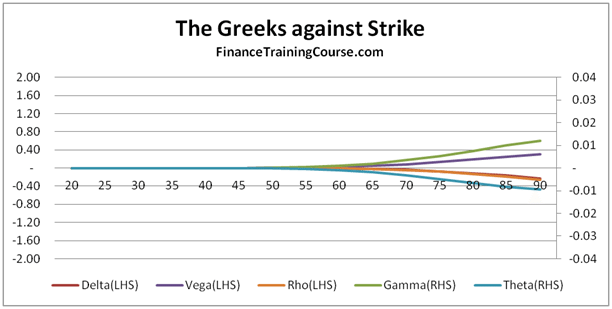
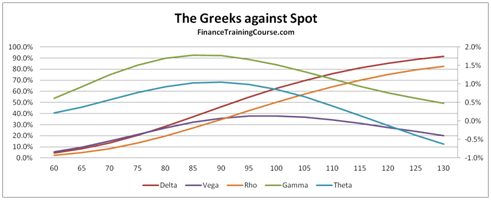
Rather than remember the formula try and remember behavior, shape and shifts. For example, see the following three panels that show the shift of the 5 Greek shapes across spot prices and “money-ness”. Starting off with a Deep out of money call option we plot the same curves for an At and near money option as well as a Deep in money option. Can you see the shift and the transition?
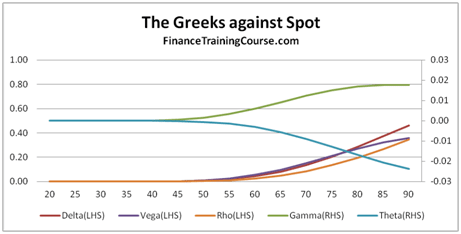
Figure 1 Delta, Gamma, Vega, Theta & Rho for a Deep out of money Call Option
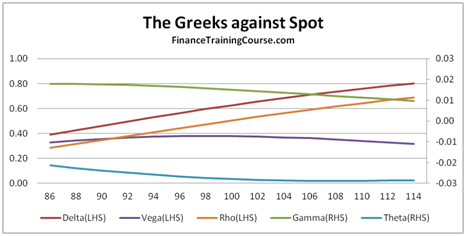
Figure 2 Delta, Gamma, Vega, Theta & Rho for At and Near Money Call Option
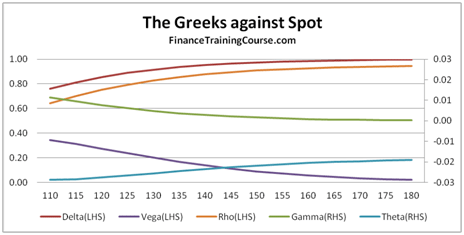
Figure 3 Delta, Gamma, Vega, Theta & Rho for a Deep In Money Call Option
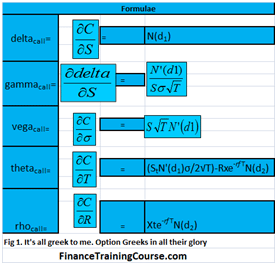
Greeks – Option Price Sensitivities – Formula Reference and one liner definition guide
The five derivative pricing and sensitivities (aka Greeks) with their equations and definition reference
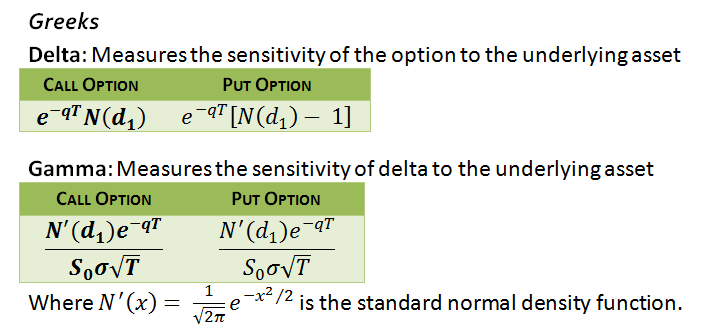
Figure 4 Option Greeks: Delta & Gamma formula reference
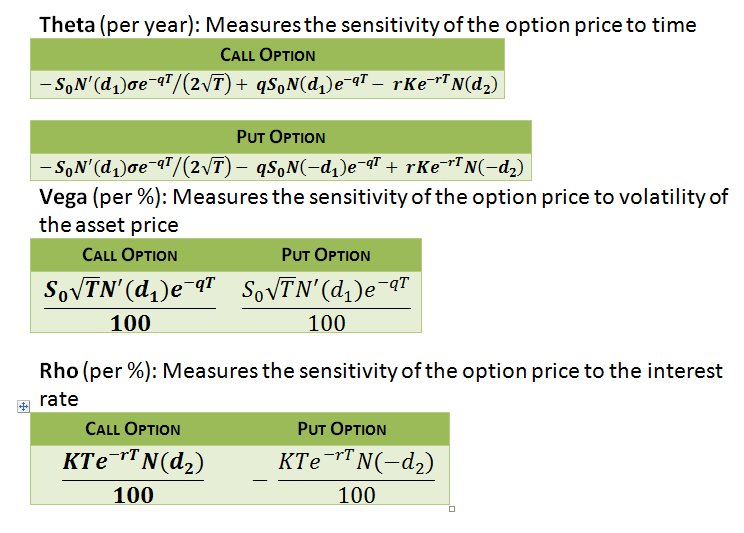
Figure 5 Option Greeks – Vega, Theta & Rho, formula reference
Option pricing – Greeks – Sensitivities – Suspects Gallery
Greeks Against Spot Prices. Here is the short series for Deep out of Money Call Option and Deep In and Out of Money Put options.

Figure 6 Deep out of money call options – Greeks plot
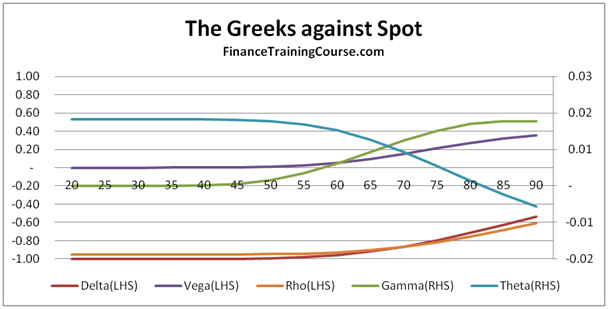
Figure 7 Deep In money put options – Greeks plot
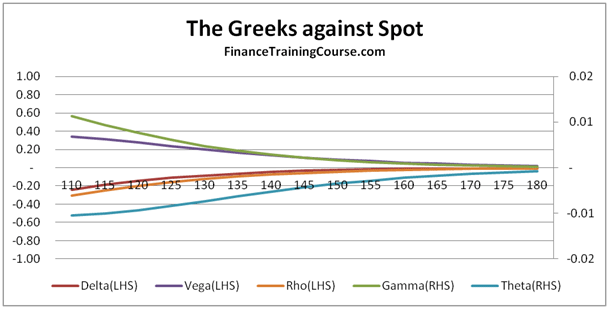
Figure 8 Deep out of money put option – Greek plot
The way to read the above graphical set is to take one Greek at a time. So starting with Delta you will see that while the shape is the same, the sign is different between the Call and the Put. For illustration we have also produced the Greek plot for a Deep out of money Put option and while there are some similarities between the Deep out of money Call and the Deep in money Put, they disappear completely when we look at the Deep out of money Put contract.
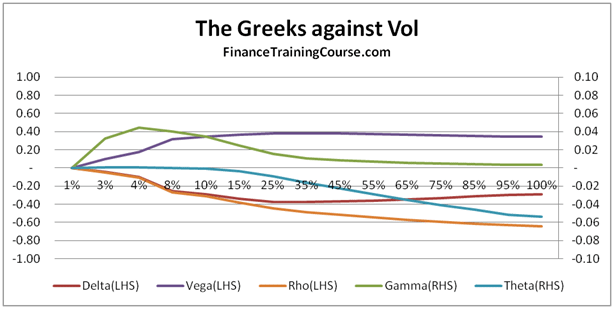
Option Price Sensitivities – Plotting Greeks against changing volatility
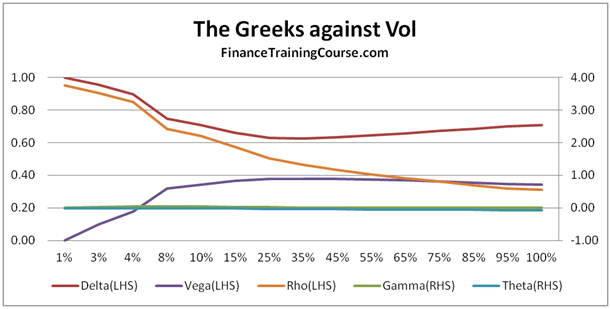
Figure 9 At money Call option – Greek Plot against changing volatilities
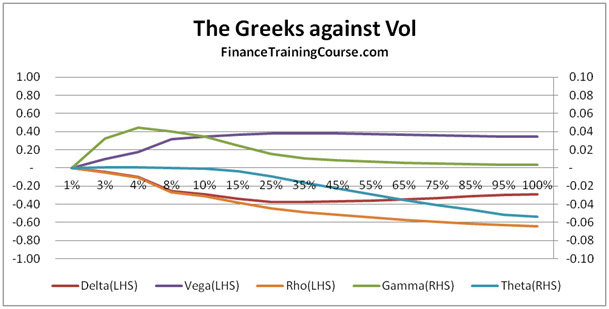
Figure 10 At money put option – Greek plot against changing volatilities
However the difference really crops up between Calls and Puts when you switch the frame of reference from changing spot prices to changing volatilities. With this new point of view Calls and Put are clearly different animals. Why is that? Or is that really the case? If you look closely you will see that as far as Vega, Delta and Rho are concerned the basic shape and shift is similar, it looks different because the LHS axis has shifted. Still Delta is different because of the sign change. But its Gamma and Theta that are really different when it comes to dissecting the behavior of Greeks across Calls and Puts. But would these differences stay if you plot the 5 Greeks across money-ness?
Option Pricing Sensitivities – Greeks – An alternate dimension
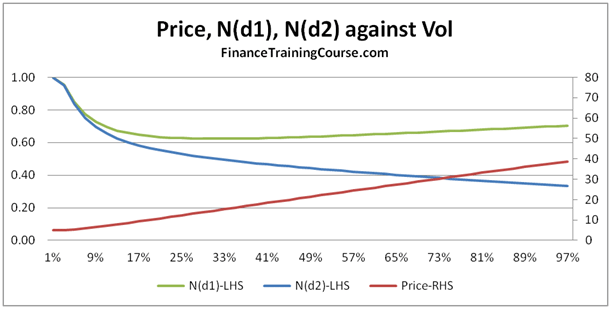
Figure 11 Plotting N(d1), N(d2) and Price against volatility
What do you think is the most common question most students have when they see figure 9 above? Do you see a contradiction? Need a hint? Take a look at Delta. Then think about how we calculate Delta for a European call option. We look at N(d1) as a conditional probability? Intuitively speaking what should we expect N(d1) to do as volatility rises? Rise or Fall? What is N(d1) doing in Figure 9 above?
Now take a look at figure 11 above? What are N(d1) and N(d2) doing as volatility rises? Is that intuitive or counter intuitive? Need a hint? Two words – volatility drag.
Think about the above question and tell us about your answers through the comment sections below in this post. Would love to hear more from you.
Related posts:
- Sales & Trading Interview Guide: Understanding Greeks: Option Delta and Gamma
- The Sales and Trading Interview Guide Series – Understanding Greeks and Delta Hedging – Coming soon to an iPad near you…
- Online Finance – Option Terminology Glossary – Greeks, exotics and volatility