First Published on Finance Training Course.com on 26th March 2011

I recently ran a presentation for a client where I had to justify setting risk limits at a pre-defined threshold for a treasury and investment management function, linking Stop Loss, Value at Risk and Management Action Triggers. The question a very astute board member asked me was a simple one:

How likely is this worst case loss and what would happen when it would actually occur?

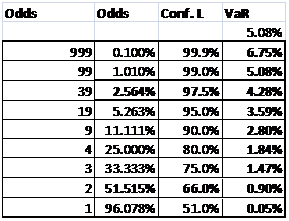
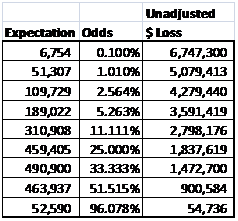
To explain my recommendation I had to lean on Nicholas Nassim Taleb and his suggestion of working with most likely loss which in this case (see table above) gave me even odds for a loss of .05%. From a pure expectation point of view it translated into 52,000 US$ alternate day (once in two days, 1:1 odd) for a 100 million US$ portfolio. That is the number the board was likely to see on every alternate day and rather than let the board sit idle and wait for the risk freight train to hit them at some point in time in the future while they were assured by their Worst Case Loss calculations, my and NNT’s suggestion was simple. Track deviation to your most likely loss rather than your unlikely loss. For two simple reasons:

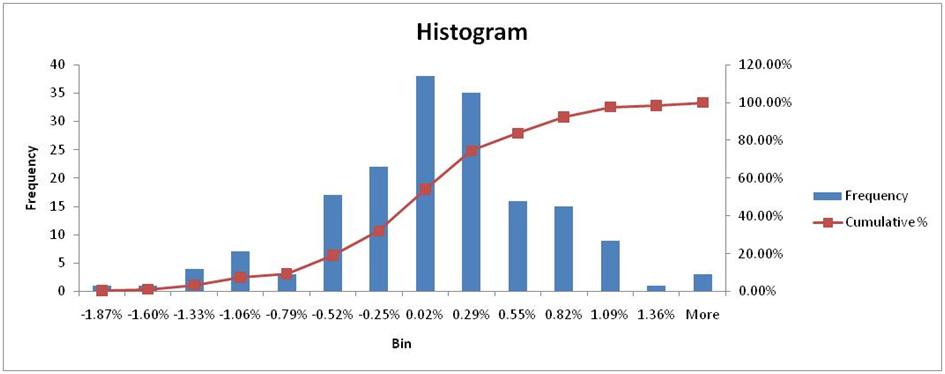
  1. You have more data points to understand the distribution
  2. The number you quote to the board, the risk function and the treasury group is actually taken a lot more seriously given its likelihood of occurrence.

It also allowed me to link the concept of stop loss with risk limits by helping set a soft stop loss limit just beyond the most likely loss and a hard stop loss limit at the last known threshold of good data which interestingly enough sat between the 51% and 66% percentile threshold.

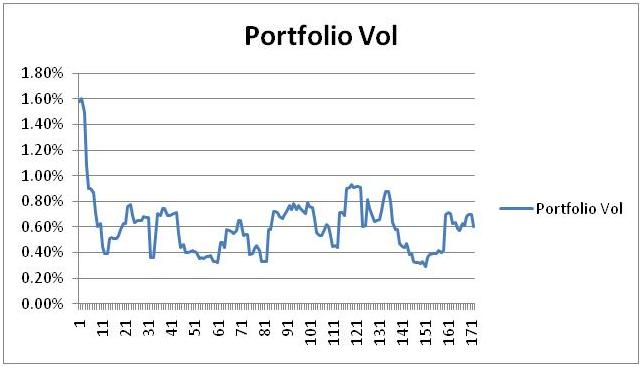
And if I was really really smart and had the right system and capabilities, I would move these limits around as the underlying portfolio volatility moved up and down in time.

The only exception to this rule was PSR limits (Pre-Settlement Limits) where I simply couldn’t walk away from worst case loss. So my question to you is

  1. Have you started thinking about communicating your risk results, targets, exceptions and breaches in Most Likely Loss terms or are you still using Worst Case Loss?
  2. Does your Board appreciate and understand and react better to Most Likely Loss or Worst Case Loss?
  3. Have you connected your stop loss triggers and thresholds to trailing market volatility?

If you would like to learn more about the topic of setting limits and using most likely loss rather than worst case loss please see our setting limits online video course at Finance Training Videos

This post was first published at Learning Corporate Finance as part of the launch campaign for Finance Training Videos.

Understanding N(d1)

It is embarrassing to confess but it is a question that stumped me the first time a student posed it.

What is N(d1) and how is it different from N(d2)?

The difference is as subtle and fundamental to derivative pricing as is fission and fusion in nuclear physics. In today’s volatile markets a subtle oversight is all it takes to land you right in the middle of a core meltdown.

Over the years I tried different explanations, carefully measuring each trial’s confusion potency. Most explanations around Black Scholes turned bright, smart, hard working exec MBA students into glassy eyed zombies within a few minutes. At times I also wondered what if that sharp trader at the Goldman interview in London had posed this stumper. Would my answer and my life turned out differently?

So when we were done with our very first video based risk training offering focusing on value at risk and capital, I knew that the next course had to be on explaining N(d1). Fortunately for me a ready audience of 30 students awaited me at the SP Jain campus to try out my latest thought experiment. Together we broke the Black Scholes equation down and put it under the microscope using the Monte Carlo simulator as our lens.

I can safely say that led to some very interesting conversations. We finally understood what conditional probabilities mean after a little bit of pain. But there is only one way you can find out if there are thirty zombies waiting for you in LC-1 at Academic city. No peeking; Try out the new Understanding N(d1) course now.

When you are running a 10,000 trial Monte Carlo simulator it is difficult to stop with just N(d1). An expanded version of the course walks you through the process of building the entire Monte Carlo simulation in Excel and then helps you extend the same model to pricing Asian, Knock In and Knock out options.

If all this talk about simulation and obnoxious variables turns your stomach you can also try our much lighter, philosophical peace offering, the Quant Crash Course for non-Quants.

Try any of the three courses before 31st March 2011 and take advantage of our US$ 99 launch prices valid only for the launch month of March (our Ides of March discount). Effective 1st of April prices revert back to their normal US$ 199 price tag.

Later modules scheduled for release post March cover tools to reduce variance, increase price convergence as well as add additional products in the FX arena including digitals, binaries, participating forwards and structured packages.

With the introduction of video based training traffic at the site has really surged in the last two weeks. If for some reason you get timeout errors especially with video sessions please drop me a note and bear with us while we work at scaling up our streaming server capacity.

This week we expect to break 3,000 weekly visitors and 8,000 weekly page views. As of March, the Finance Training Course platform has already crossed 60,000 visitors and 135,000 page views, with traffic doubling every four months. We wouldn’t be here without the role all of you have played over the last four years in getting Finance Training Courses and Alchemy to where they stand today.

Thank you.

Yours

Jawwad

(Ps. I will look forward to that note J)