Rebalancing frequency, Implied Volatility & Rho. Dynamic Delta Hedging Applications.

Now that we have a Delta Hedging Model for Calls and Puts let’s try and use it to answer the following questions:

a) What is the impact of rebalancing frequency on hedging profitability?

b) What is the impact of a rise in volatility on profitability? How does implied volatility help in interpreting this change?

c) What is the impact of changes in risk free rates on profitability?

d) How does the interaction of time to expiry and volatility changes profitability?

These are all questions that should occur naturally to you as you spend more time with the Delta Hedging model. They are also essential to building a deeper understanding of the concept of implied volatility, Rho & Theta.

Dynamic Delta Hedging Questions: Assumptions & Securities

Let’s take a look at these questions one by one. We will begin work with a call option assuming the following valuation parameters:

Figure 1 Dynamic Delta Hedging – P&L review assumptions

The theoretical value of the call option is 3.01 based on the above assumptions. The resulting Cash Accounting P&L for a single run of the Dynamic Delta Hedging model is as under:

Figure 2 Dynamic Delta Hedging – P&L Review – Base case

Rebalancing frequency & efficiency of the hedge. Implications for profitability?

A good hedge is one where the cost of the hedge is close to the theoretical value of the option. In our cash accounting P&L we have included the theoretical premium received which is used in determining the initial amount to be borrowed. Hence for a hedge to be considered good or efficient the Net P&L should be close to this premium amount.

To see if increasing the frequency led to better results, we increase the time steps used from 12 steps to 365 steps. The graph below plots the Net P&L to Theoretical Value across 100 simulated runs. A value close to 100% means that it is a close match to the premium whereas a value farther away for 100% indicates a poor match.

Figure 3 Dynamic Delta Hedging – P&L Simulation – Rebalancing frequency

We can clearly see that there is much greater variation when the rebalancing is done on a monthly basis than when it is carried out on a daily basis.

The graph below gives a similar picture. In this case however, the premium is not considered when determining the amount to be borrowed at option inception, i.e. the hedge is fully funded through borrowing. A value of -100% indicates that the Net P&L i.e. the cost of the hedge, in this case exactly matches the theoretical value of the call option.

Figure 4 Dynamic Delta Hedging – P&L Simulation – Hedge Effectiveness

But that is the risk manager’s point of view. What about a trader’s point of view?

From a trading point of view there are two lessons here. First the large variation in P&L linked to jump’s in the underlying price is the un-hedged Gamma at work (Is that true? Think about it). Second would you prefer to limit the cost of hedging the option to the amount you have charged your customer or less? If you are in the business of earning a living from writing options, the premium you charge on the options you sell should always be higher than your cost; your cost of effectively hedging the option.

Now back to the Gamma question. Gamma is your second order error term. Conceptually it’s similar to convexity and linked to changes in not just the underlying price but also volatility. Is your true P&L (the premium received less the actual cost of hedging) is the summation of the hedge error?

Volatility and profitability. The question of implied volatility

With volatility there are multiple questions. How does profitability change when the general environment moves from low volatility to high volatility? How does profitability change when you have already written an option and volatility moves for or against you?

Let’s start from the first question. Using the 12-step model we calculate the impact on Net P&L. In our base case we have assumed a volatility of 20%. Let us now assume that the volatility increases to 40%. What is the impact on hedge efficiency for options written in the two different environment?

Figure 5 Volatility & Profitability – Low volatility world

Figure 6 Volatility & Profitability – High Volatility world

So premiums are clearly higher and so is profitability in absolute terms. But is that true in the relative world? Let’s take a quick look by plotting the Net P&L to Theoretical Value across 100 simulated runs. In relative terms (as a % of premiums) there is not much difference. Why is that? Is this a result you expected?

Figure 7 Dynamic Delta Hedging – P&L Simulation – Volatility Impact

To answer these questions you have to revisit implied volatility. Let’s use the same scenario as above but with a minor change. We wrote options and received premiums assuming an implied volatility of 30%. The actual realized volatility over the life of the option was 20%. How did that change our resulting simulated P&L.

Figure 8 Implied volatility at work – Hedge Profitability

You can now see a clear difference in absolute as well as relative terms in net P&L. And the difference arises on account of the spread between the premium charged ($8.13) versus the premium needed ($3.01).

(To run this exercise using the Delta Hedge Sheet, simply calculate the value of the premium at the implied volatility level you want to charge and replace the original premium in the simulation with this value).

Risk free rates & profitability. The question of Rho.

We present the results of three P&L simulations runs in the tables below. The first assumes a risk free interest rate of 1%, the 2nd uses 2% and the third uses a risk free interest rate estimate of 5%.

The first two are easy, rates go up, premiums goes up and a European Call option becomes more expensive. Why is that?

Figure 9 Dynamic Delta Hedging profitability – P&L at 1% interest rates

The reason is the average interest paid column. The premium goes up by 28 cents of which 21 cents is the increased cost of financing the borrowed position. Where does the other 7 cents comes from? (Need a hint – Other than the borrowing component who else benefits or uses r, the risk free rate?)

Figure 10 Dynamic Delta Hedging profitability – P&L at 2% interest rate

The second one is more difficult. In this instance as rates increase to 5% from the original 1%, the cost of borrowing balloons to $1.95 from the original $0.30 but the impact in option premium is only $1.244. How does this work? (Hint, think about what other driver/factor in the Black Scholes Analysis uses r?)

Figure 11 Dynamic Delta Hedging profitability – P&L at 5% interest rates

In addition to borrowing the difference between premium received and Delta hedge, the other usage of the risk free rate, r, is in estimating the future value of the underlying asset in the BSM (Black Scholes Model’s) risk neutral world. This implies that there are other components of Rho, in addition to the borrowing cost. That you need to examine and be comfortable with.

Understanding Greeks & Delta Hedging

Related posts:

  1. Understanding Delta Hedging for options using Monte Carlo Simulation
  2. Dynamic Delta Hedging – Calculating Cash PnL (Profit & Loss) for a Call Option writer
  3. Dynamic Delta Hedging – Extending the Monte Carlo simulation model to Put contracts

Greeks – Option Price Sensitivities – A cheat sheet to Delta, Gamma, Vega, Theta & Rho.

While we have done a few posts earlier about option price sensitivities, here is a quick reference guide for the truly lost and confused. For convenience the reference guide has been broken down into the following sections

  • Greeks Formula Reference
  • Greeks – Suspects Gallery – a visual review of option Greeks across 4 dimensions and money-ness

How to analyze Greeks in time for your final exam/interview/assessment/presentation tomorrow morning

While there are many ways of dissecting Greeks a framework or frame of reference helps. Here are some basic ground rules.

1. Remember the first order Greeks and separate them from second order sensitivities. Delta, Theta & Rho are first order (linear) Greeks which means that they will be different for Call Options and Put Options. Gamma and Vega are second order (non linear) Greeks which means that they will be exactly the same for Calls and Puts.

2. Remember that in most cases Greeks will behave differently depending on the “in-the-money-ness” of the option. Greeks will behave and look differently between Deep Out, At, Near and Deep In the money options.

3. Think how the Greeks will change or move as you change the following parameters:

  • Spot
  • Strike Price
  • Time to Maturity or expiry
  • Volatility of the underlying
  • Interest Rates

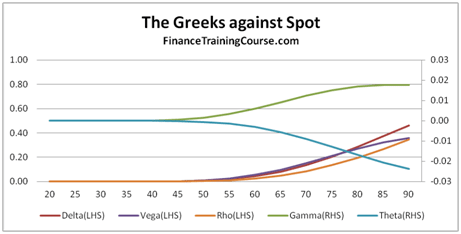
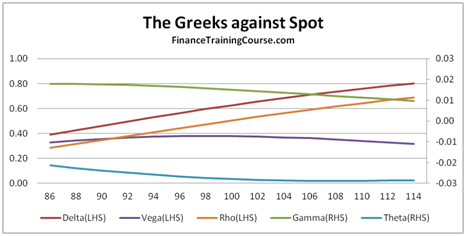
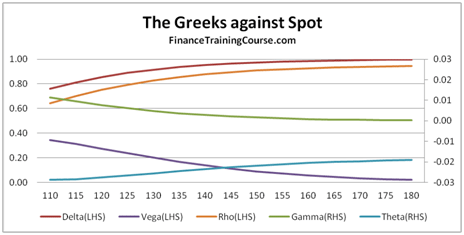
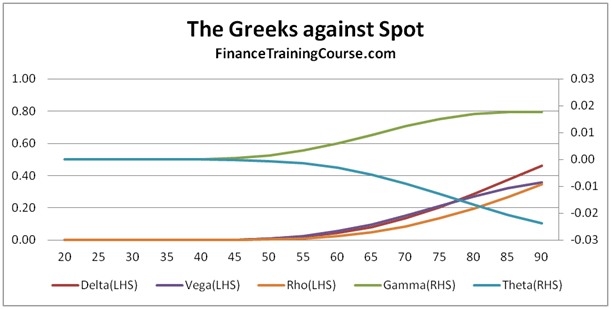
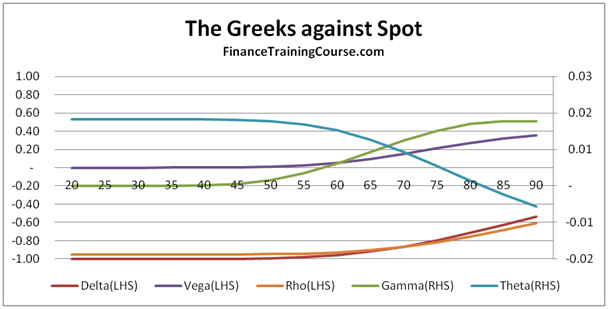
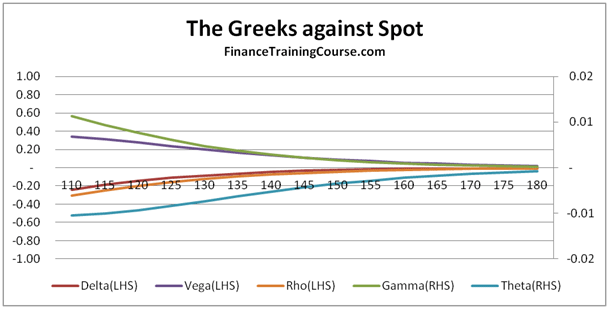
Rather than remember the formula try and remember behavior, shape and shifts. For example, see the following three panels that show the shift of the 5 Greek shapes across spot prices and “money-ness”. Starting off with a Deep out of money call option we plot the same curves for an At and near money option as well as a Deep in money option. Can you see the shift and the transition?

Figure 1 Delta, Gamma, Vega, Theta & Rho for a Deep out of money Call Option

Figure 2 Delta, Gamma, Vega, Theta & Rho for At and Near Money Call Option

Figure 3 Delta, Gamma, Vega, Theta & Rho for a Deep In Money Call Option


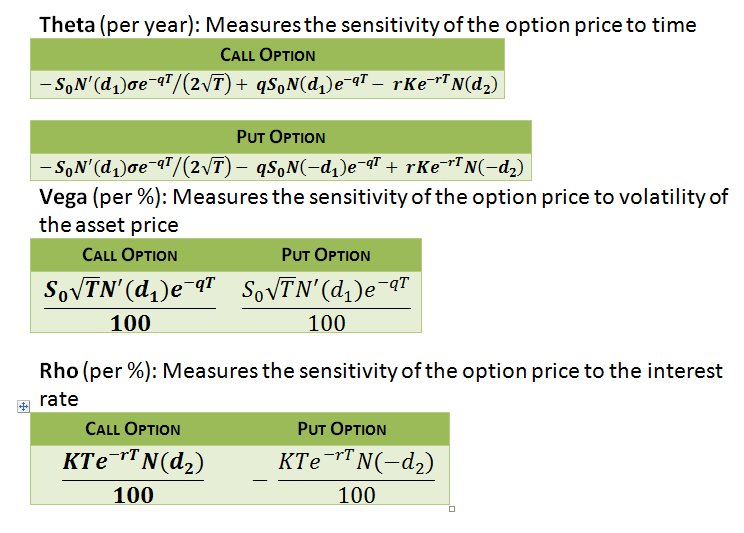
Greeks – Option Price Sensitivities – Formula Reference and one liner definition guide

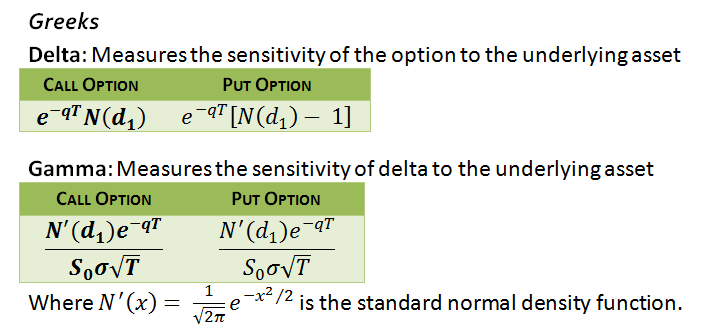
The five derivative pricing and sensitivities (aka Greeks) with their equations and definition reference

Figure 4 Option Greeks: Delta & Gamma formula reference

Figure 5 Option Greeks – Vega, Theta & Rho, formula reference

Option pricing – Greeks – Sensitivities – Suspects Gallery

Greeks Against Spot Prices. Here is the short series for Deep out of Money Call Option and Deep In and Out of Money Put options.

Figure 6 Deep out of money call options – Greeks plot

Figure 7 Deep In money put options – Greeks plot

Figure 8 Deep out of money put option – Greek plot

The way to read the above graphical set is to take one Greek at a time. So starting with Delta you will see that while the shape is the same, the sign is different between the Call and the Put. For illustration we have also produced the Greek plot for a Deep out of money Put option and while there are some similarities between the Deep out of money Call and the Deep in money Put, they disappear completely when we look at the Deep out of money Put contract.

Option Price Sensitivities – Plotting Greeks against changing volatility

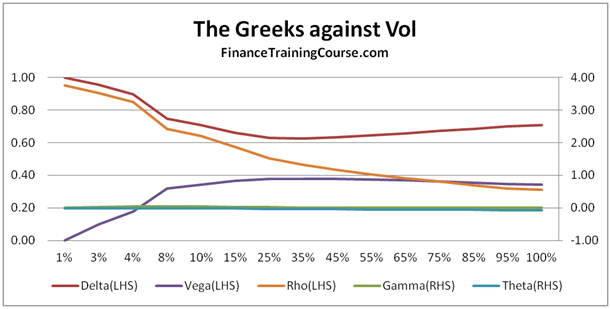
Figure 9 At money Call option – Greek Plot against changing volatilities

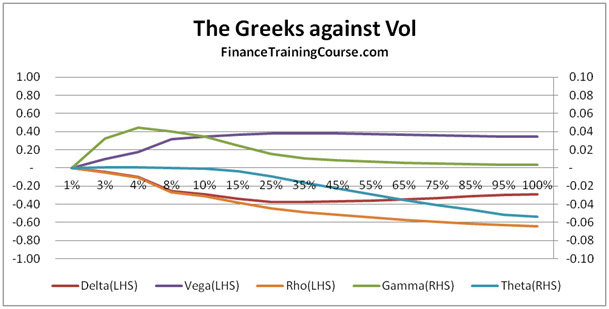
Figure 10 At money put option – Greek plot against changing volatilities

However the difference really crops up between Calls and Puts when you switch the frame of reference from changing spot prices to changing volatilities. With this new point of view Calls and Put are clearly different animals. Why is that? Or is that really the case? If you look closely you will see that as far as Vega, Delta and Rho are concerned the basic shape and shift is similar, it looks different because the LHS axis has shifted. Still Delta is different because of the sign change. But its Gamma and Theta that are really different when it comes to dissecting the behavior of Greeks across Calls and Puts. But would these differences stay if you plot the 5 Greeks across money-ness?

Option Pricing Sensitivities – Greeks – An alternate dimension

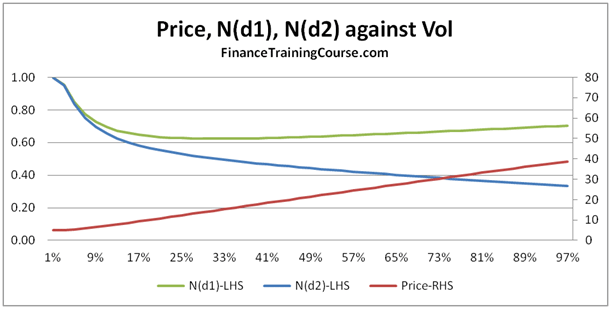
Figure 11 Plotting N(d1), N(d2) and Price against volatility

What do you think is the most common question most students have when they see figure 9 above? Do you see a contradiction? Need a hint? Take a look at Delta. Then think about how we calculate Delta for a European call option. We look at N(d1) as a conditional probability? Intuitively speaking what should we expect N(d1) to do as volatility rises? Rise or Fall? What is N(d1) doing in Figure 9 above?

Now take a look at figure 11 above? What are N(d1) and N(d2) doing as volatility rises? Is that intuitive or counter intuitive? Need a hint? Two words – volatility drag.

Think about the above question and tell us about your answers through the comment sections below in this post. Would love to hear more from you.

Related posts:

  1. Sales & Trading Interview Guide: Understanding Greeks: Option Delta and Gamma
  2. The Sales and Trading Interview Guide Series – Understanding Greeks and Delta Hedging – Coming soon to an iPad near you…
  3. Online Finance – Option Terminology Glossary – Greeks, exotics and volatility

Preparing for the quantitative portion of a sales and trading interview for a main street bank is a nightmare. Specially if the bank is an active derivative trader and wants it intake class of interns and full time analysts and associates to hit the Sales and Trading desk running.

While basic option concepts generally get covered quite well in the MBA curriculum, when it comes to option price sensitivities and Greeks, our understanding remains rudimentary and superficial. One reason is the focus on formulas and calculation rather than intuition and understanding. Most courses have run out of time when it comes to delta, gamma, vega, theta and rho and stop after a basic rudimentary coverage of the material.

There is a lot of good material available on basic quantitative and numerical techniques tested in a Sales and Trading interview. But when it comes to option price sensitivities or Greeks, available material generally looks like this.

As part of the work we do with customers and students, our Apple iPad iBooks team is working on two very interesting and exciting titles.

The first is the Sales and Trading Interview Guide – Understanding Greeks for Dummies. Using the interactive iBook template we will help you master your Greeks to such a level where future mention of delta, gamma, vega, theta and rho would no longer break you out in cold sweat and palpitations. The iBook will cover Greeks behavior across time, volatility, spot and strike prices using easy to understand language, graphs and self assessment quizes.

But it’s the second iPad iBook title that we are really excited about. Sales and Trading Interview Guide – Delta Hedging and other higher dimensions, will help you build your own delta hedging sheet in excel using Monte Carlo Simulation. Both iPads books will have options for purchasing supporting excel spread sheets that extend the concepts covered in the iBook.

Planned for release in mid September, the two books will increase our inventory of interactive iBook for iPad titles to 5. Please feel free to drop me a note if you would like to learn more about the release dates and table of content for both titles.

Related posts:

  1. Asset Liability Management (ALM) Study Guide for Board Members – coming soon to an iPad near you.
  2. Understanding ALM and Calculating Value at Risk iBooks featured on the Apple iTunes store
  3. Accounting Crash Course: Small Business Accounting Training – Sales Journal and Sales Ledgers